Turtle Games
Customer Segmentation & Sales Optimisation
Predictive analytics using Python & R
The project was aimed at investigating customer loyalty and optimising sales performance for Turtle Games, a global gaming retailer and manufacturer.

-
The report considered 4 primary business questions as proposed by Turtle Games:
How do customers accumulate loyalty points?
How can customers be segmented into groups?
How can customer reviews be used to inform marketing campaigns?
How can descriptive statistics be used to enhance insights?
-
Conducted Linear Regression, Decision Trees to identify correlations and predictors of loyalty points.
Segmented customers into groups using K-Means clustering.
Conducted Natural Language Processing using machine learning models such as TextBlob & Vader to analyse customer reviews.
Applied statistical analysis on the dataset to analyse distributions, skewness, kurtosis and outliers for enhanced insights.
-
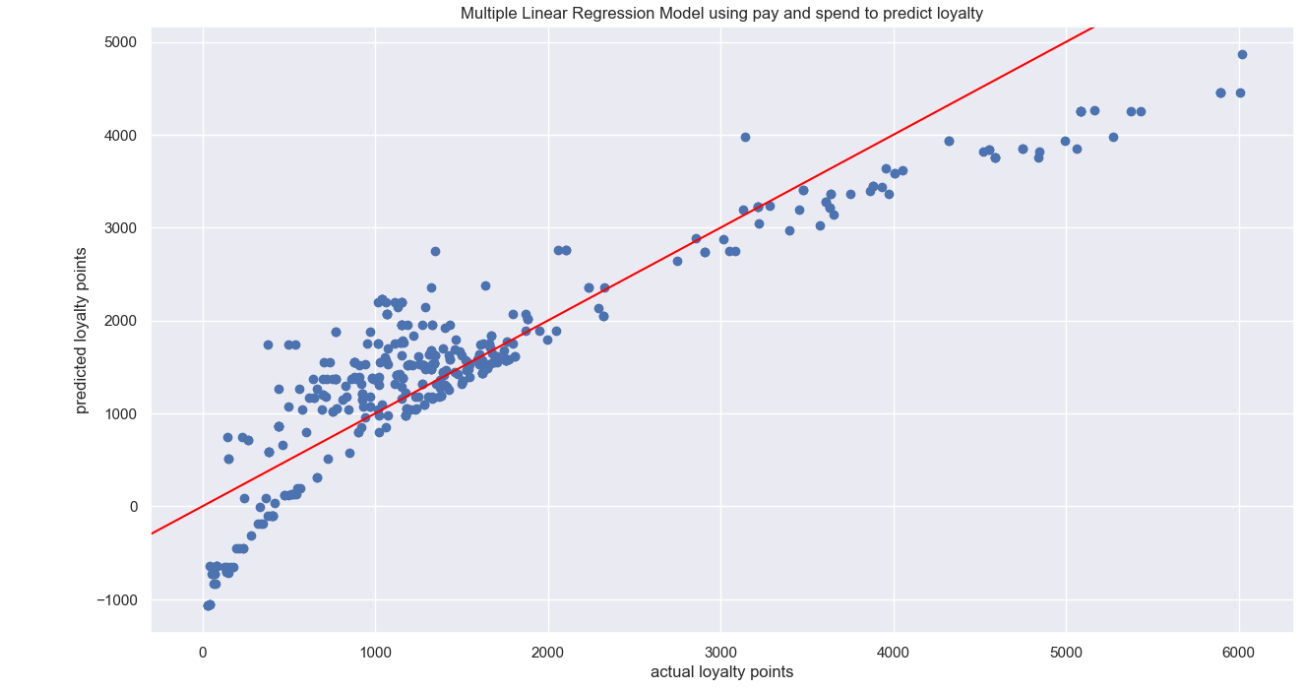
Built a robust multiple linear regression model using income and spending score to explain 83% variation in loyalty points. However, the presence of uneven variance in errors (heteroscedasticity) due data quality issues was recommended to be addressed for reliable predictions.
Using K-Means clustering, I identified 5 distinct customer segments to be targeted based on varying levels of income and spending score. Suggested customised marketing strategies for each of these 5 segments.
Statistical analysis showed a right skewed distribution in the loyalty points variable, with presence of outliers. Recommended to leverage this segment for exclusive loyalty programs as this segment had on average 4 times as many loyalty points as the non outlier group.
NLP insights into customer sentiment led to recommendations for leveraging feedback and addressing product quality and usability issues.
-
Excel
Python (Jupyter Notebook)
R (R Studio)
-
This project lasted 6 weeks and I received a final grade of High Distinction
Key insights and recommendations


Insights and Recommendations
Key insights
A multiple linear regression model using income and spending score can explain 83% of the variation in loyalty points, although the presence of heteroscedasticity will need to be addressed by Turtle Games.
K means clustering using the ‘elbow’ and ‘silhouette’ methods identified 5 distinct customer segments based on income and spending score.
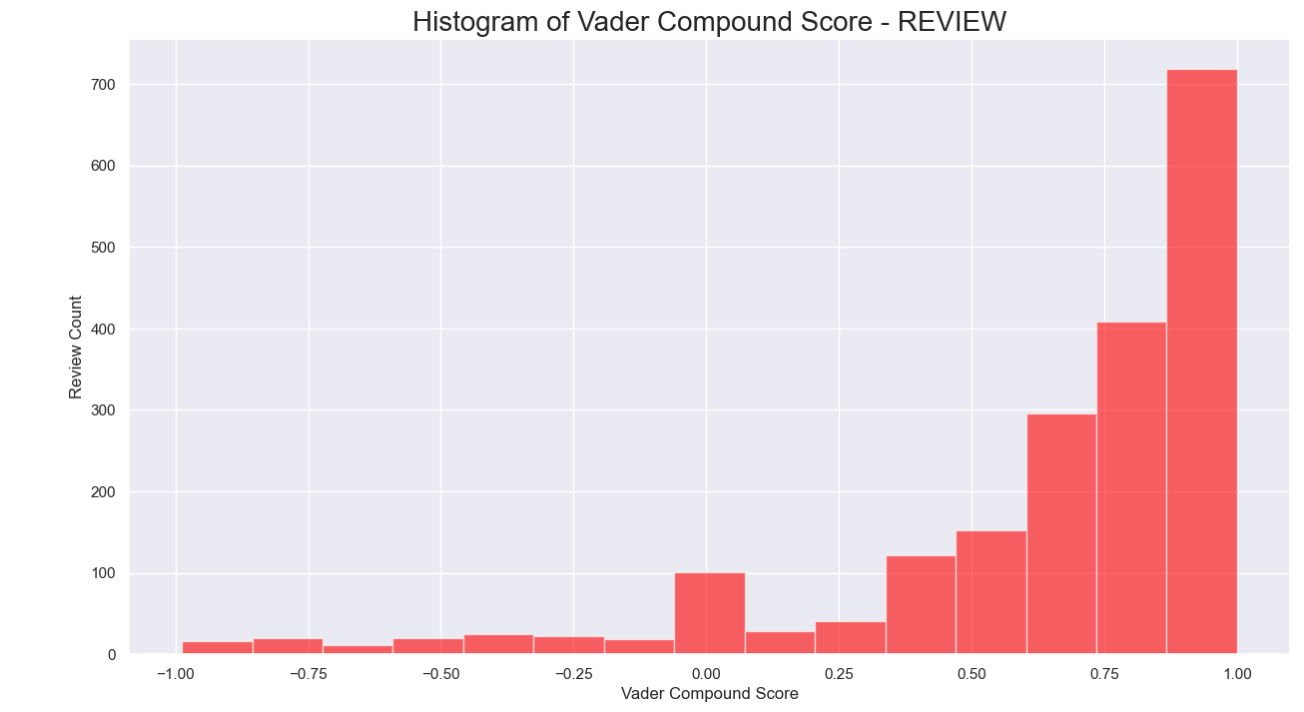
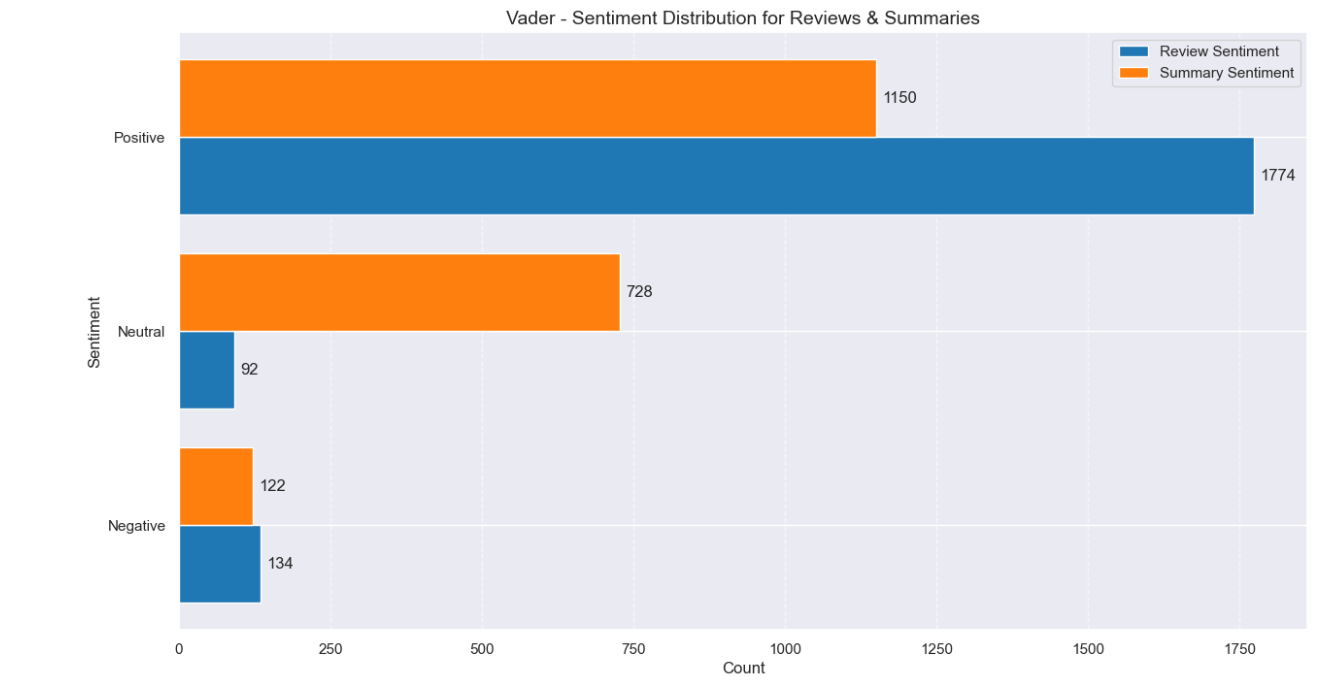
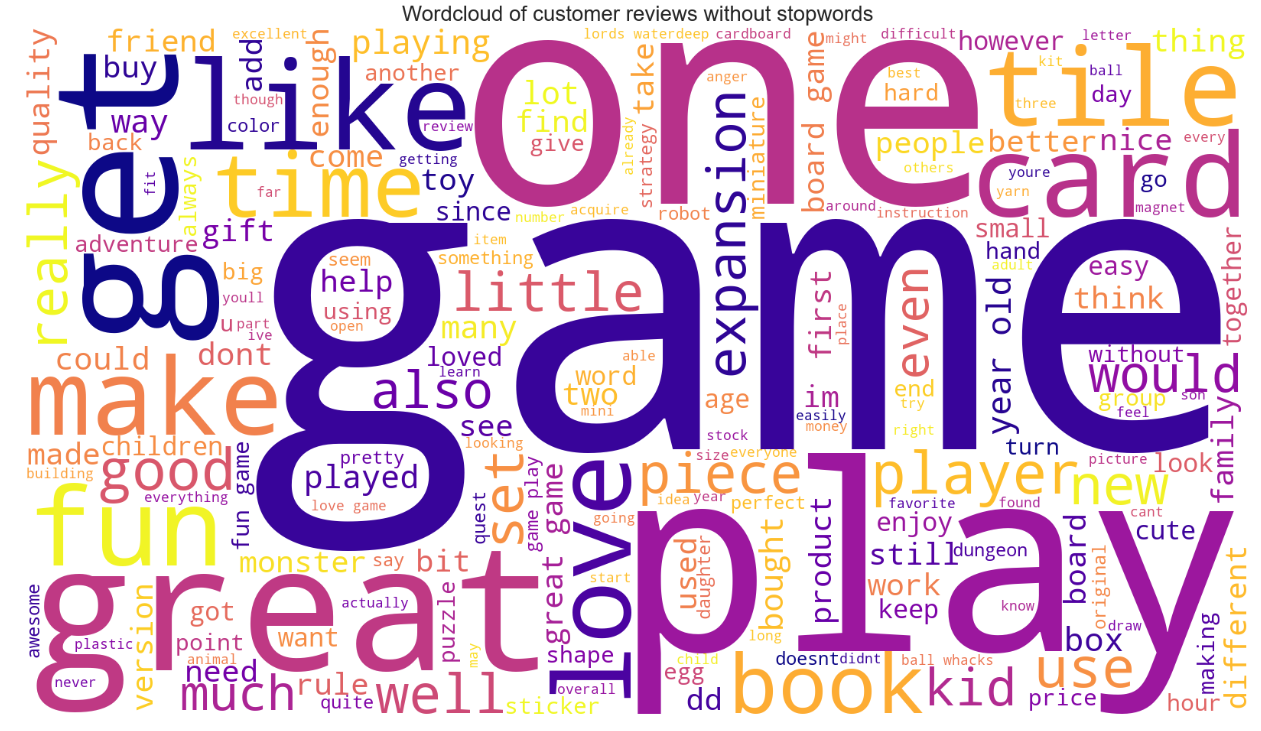
Natural language processing using models such as TextBlob and Vader allowed immediate insights using Word clouds to understand frequently mentioned words such as (‘great’, ‘fun’, ‘difficult’, ‘disappointed’). Histograms confirmed majority of the sentiment was positive for customer reviews.
Using statistical analysis in R, I identified right skewness and outliers in the loyalty points variable to be leveraged by Turtle Games.
Key recommendations
K-means clustering identified 5 distinct customer segments based of different levels of income and spending score. Recommended to tailor customized marketing strategies to each of these 5 segments.
While the customer review data showed an overall positive sentiment, I recommended that Turtle Games should invest in customer experience by incorporating positively mentioned words in the advertising campaigns, and addressing product quality and usability issues as highlighted in negative reviews.
Leverage the outliers in the loyalty points variable as a strategic segment. On average they have about 4 times as many loyalty points, suggesting they are a completely separate group. Further analysis showed a strong (79%) correlation between income and loyalty points within this segment. Based on this I recommended targeting high income customers, especially in the top 25% pay range as they accumulated the highest average loyalty points.
Recommended investing in data quality for reliable predictive power as observed from my multiple linear regression analysis. Although my model achieved a healthy R-Squared of 83%, the presence of heteroscedasticity undermines the validity of the model.